- Company

JK Lakshmi Cement, A Legacy of Shaping India's Infrastructure.
JK Lakshmi Cement is a proud member of the esteemed JK Organisation, a leading industrial force with over 140 years.
- Our Offerings
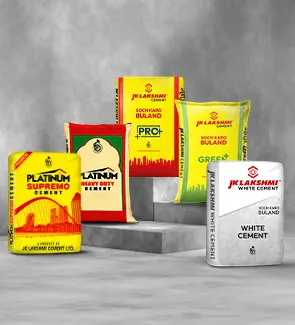
JK Lakshmi Cement, A Legacy of Shaping India's Infrastructure.
JK Lakshmi Cement is a proud member of the esteemed JK Organisation, a leading industrial force with over 140 years.
- Investors
JK Lakshmi Cement, A Legacy of Shaping India's Infrastructure.
JK Lakshmi Cement is a proud member of the esteemed JK Organisation, a leading industrial force with over 140 years.
- Chairman’s Statement
- Companies Polices/ Code/ Other Information
- Listing/Composition of Committees
- Financial Information
- Shareholders and Filing
- Shareholding Pattern
- Investor Conference Call
- Secretarial Compliance Report
- Annual Return
- Credit Rating
- Postal Ballot
- KYC Documents
- TDS Communication 2026-27
- Other Filings with Stock Exchange
- Shareholder Enquiry
- Foreign Shareholders of erstwhile OSL
- Memorandum and Articles of Association
- Newspaper Advertisement
- Unclaimed Amount and Shares
- Investor Grievance and Contact Details
- Scheme of Arrangement
- Assurance Certificate
- Sustainability
JK Lakshmi Cement, A Legacy of Shaping India's Infrastructure.
JK Lakshmi Cement is a proud member of the esteemed JK Organisation, a leading industrial force with over 140 years.
- Newsroom
JK Lakshmi Cement, A Legacy of Shaping India's Infrastructure.
JK Lakshmi Cement is a proud member of the esteemed JK Organisation, a leading industrial force with over 140 years.
- Connect with us
JK Lakshmi Cement, A Legacy of Shaping India's Infrastructure.
JK Lakshmi Cement is a proud member of the esteemed JK Organisation, a leading industrial force with over 140 years.